Debugging React Native Apps with Breakpoints
Debugging React Native apps with breakpoints is a powerful way to identify and fix bugs, as well as understand new codebases quickly. Setting up the debugging environment for React Native development has been historically difficult, so I thought detailing how we debug with breakpoints, our source codes at Instamobile, might come in handy, especially to those who are fairly new to React Native. You will learn how to set up breakpoints in React Native apps.
First of all, YES, it is possible to debug React Native apps with breakpoints. The React Native Debugger tool is an extremely powerful debugging environment, working really fast too. I was impressed when I first worked with it, since it feels way faster than Xcode itself (for native code). So say bye, bye to the “console.log debugging” – give up already – you’re wasting precious time. It takes less than 5 minutes to install and configure the React Native Debugger, and it will save you many days in the long run.
For those who want to learn how to set up the React Native debugger so that they can use breakpoints in React Native code, here’s a summary:
-
Install React Native Debugger tool
- brew update && brew cask install react-native-debugger
-
Launch the React Native Debugger app from the Applications folder (you can just search for it in the Spotlight)
-
(Alternatively) You can use Google Chrome directly, by triggering its Developer Tools (Command + Option + I)
-
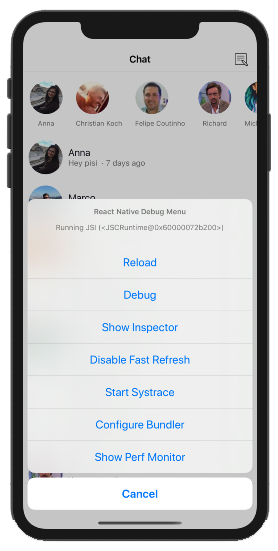
Open an iOS simulator and press Command + D to open the debug menu. Select “Debug” option.
-
In the React Native Debugger window, select View -> Toggle Developer Tools
-
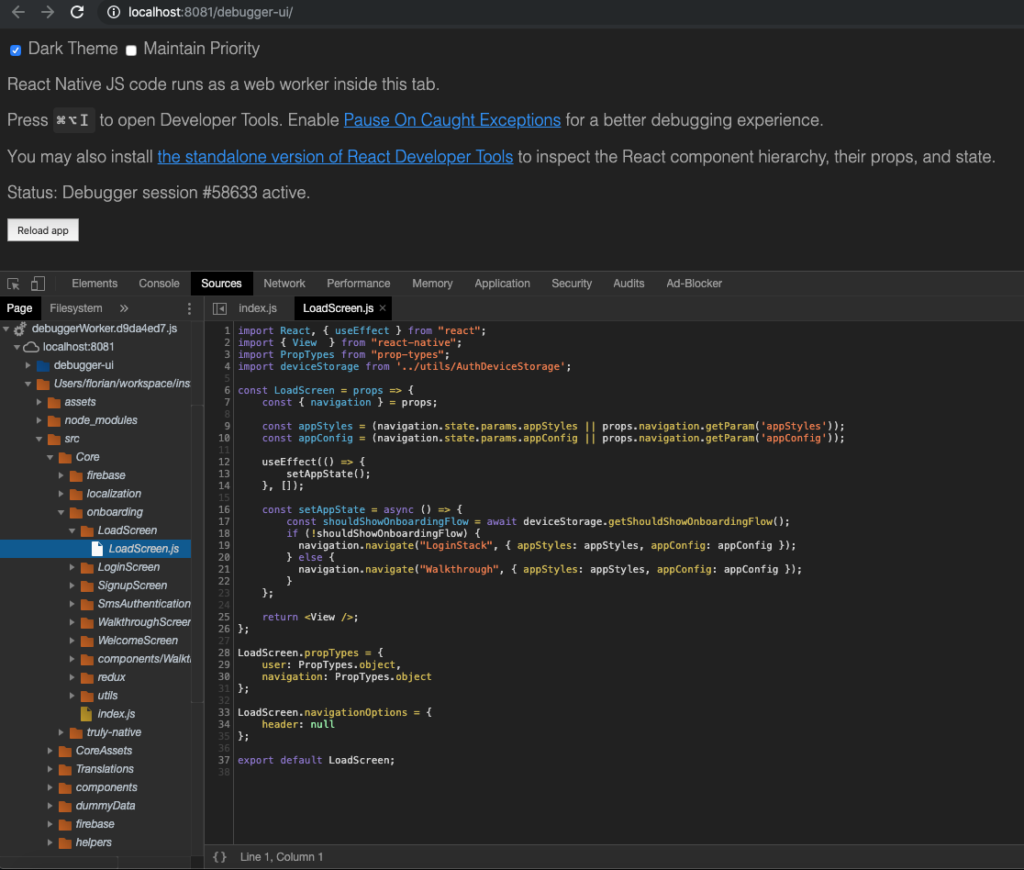
Then click on the Sources tab
Mega Bundle Sale is ON! Get ALL of our React Native codebases at 90% OFF discount 🔥
Get the Mega Bundle-
In the left side menu, you can expand RNDebuggerWorker.js, then expand the localhost:** subitem. Locate your project’s root folder, and find the .js files where you want to set the breakpoints.
-
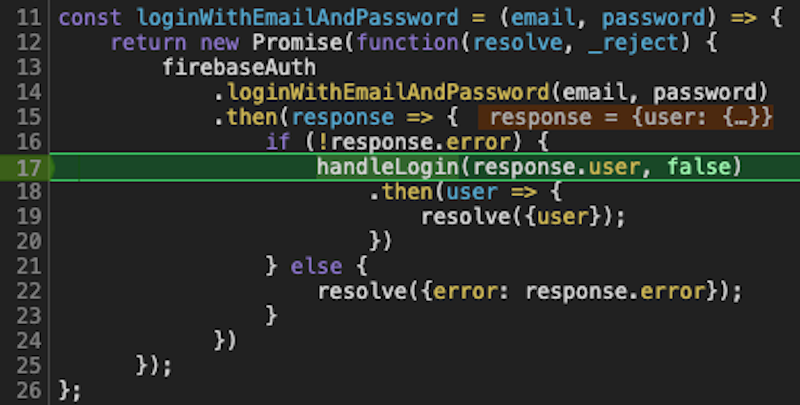
Select a file and add a breakpoint, by clicking on the line number (a breakpoint will highlight the number in green).
-
Run the app in the simulator (if it wasn’t already) – play with it, and go the screen that is supposed to execute the code path containing your breakpoints.
-
When a breakpoint gets hit, the execution will stop on that line. In the debugger, the entire line will be highlighted in green, and the simulator will freeze.
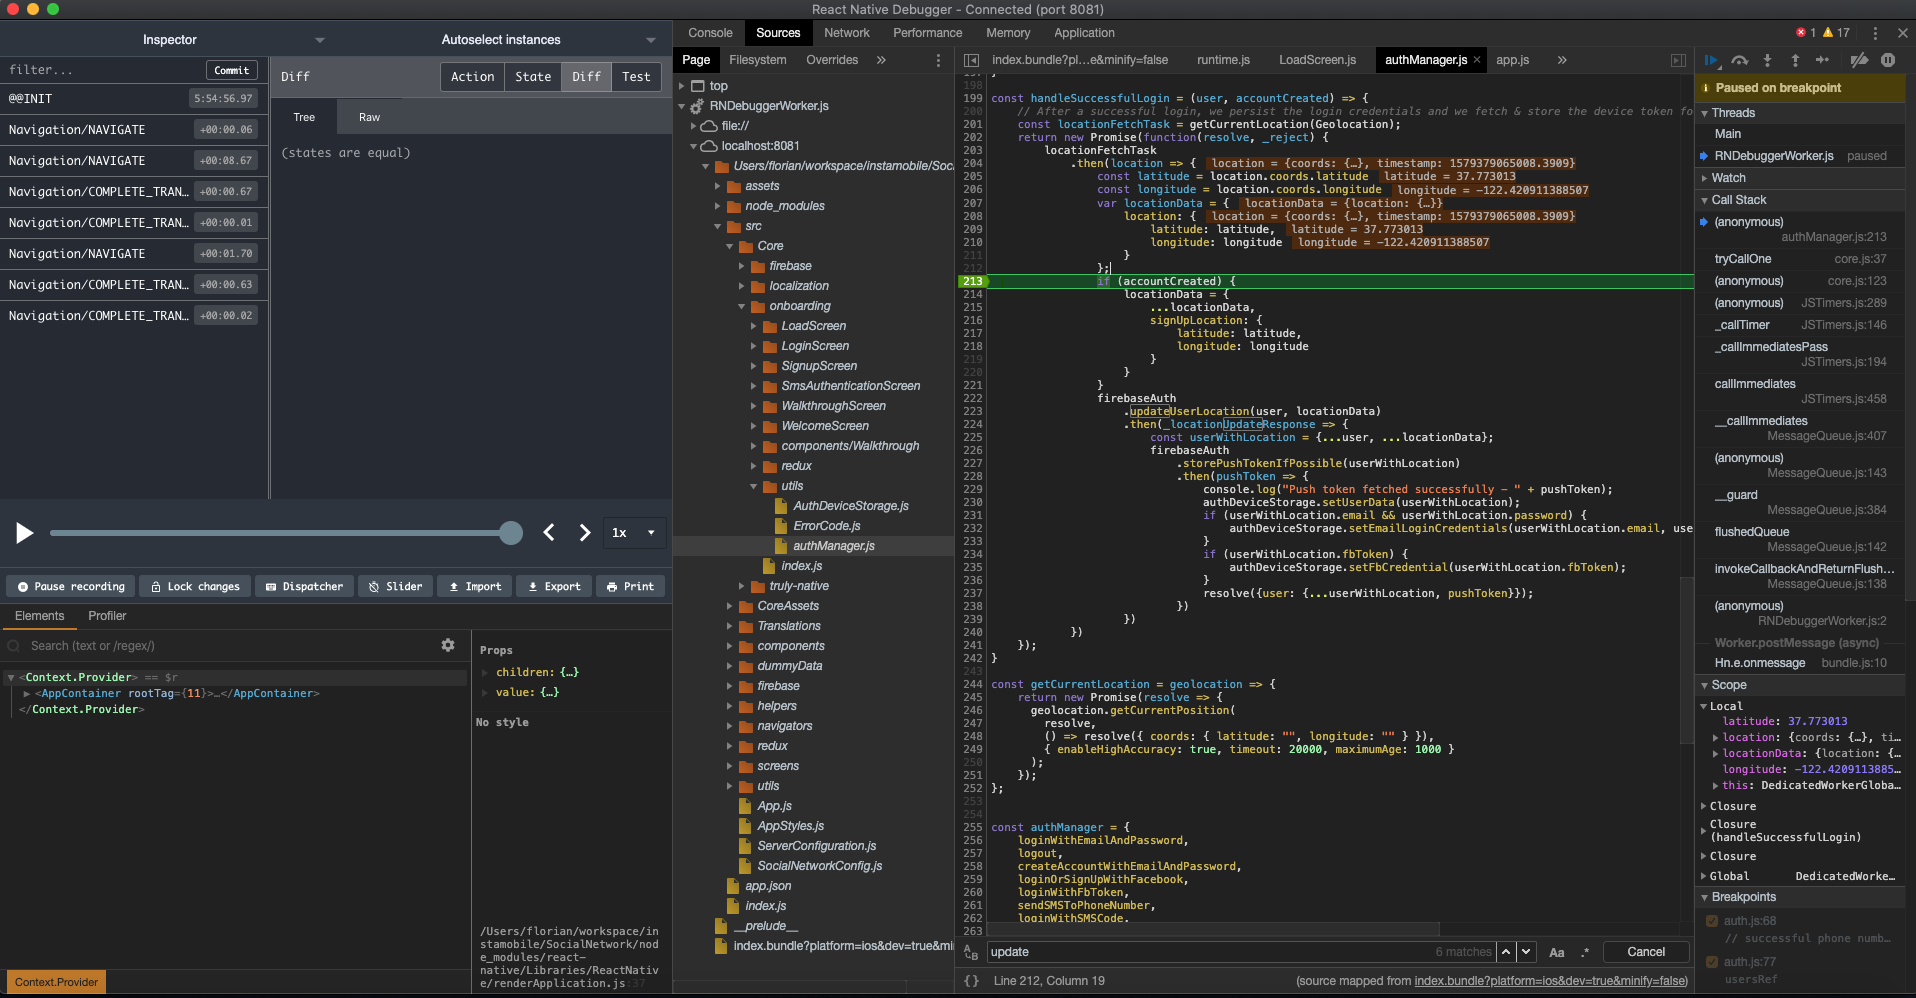
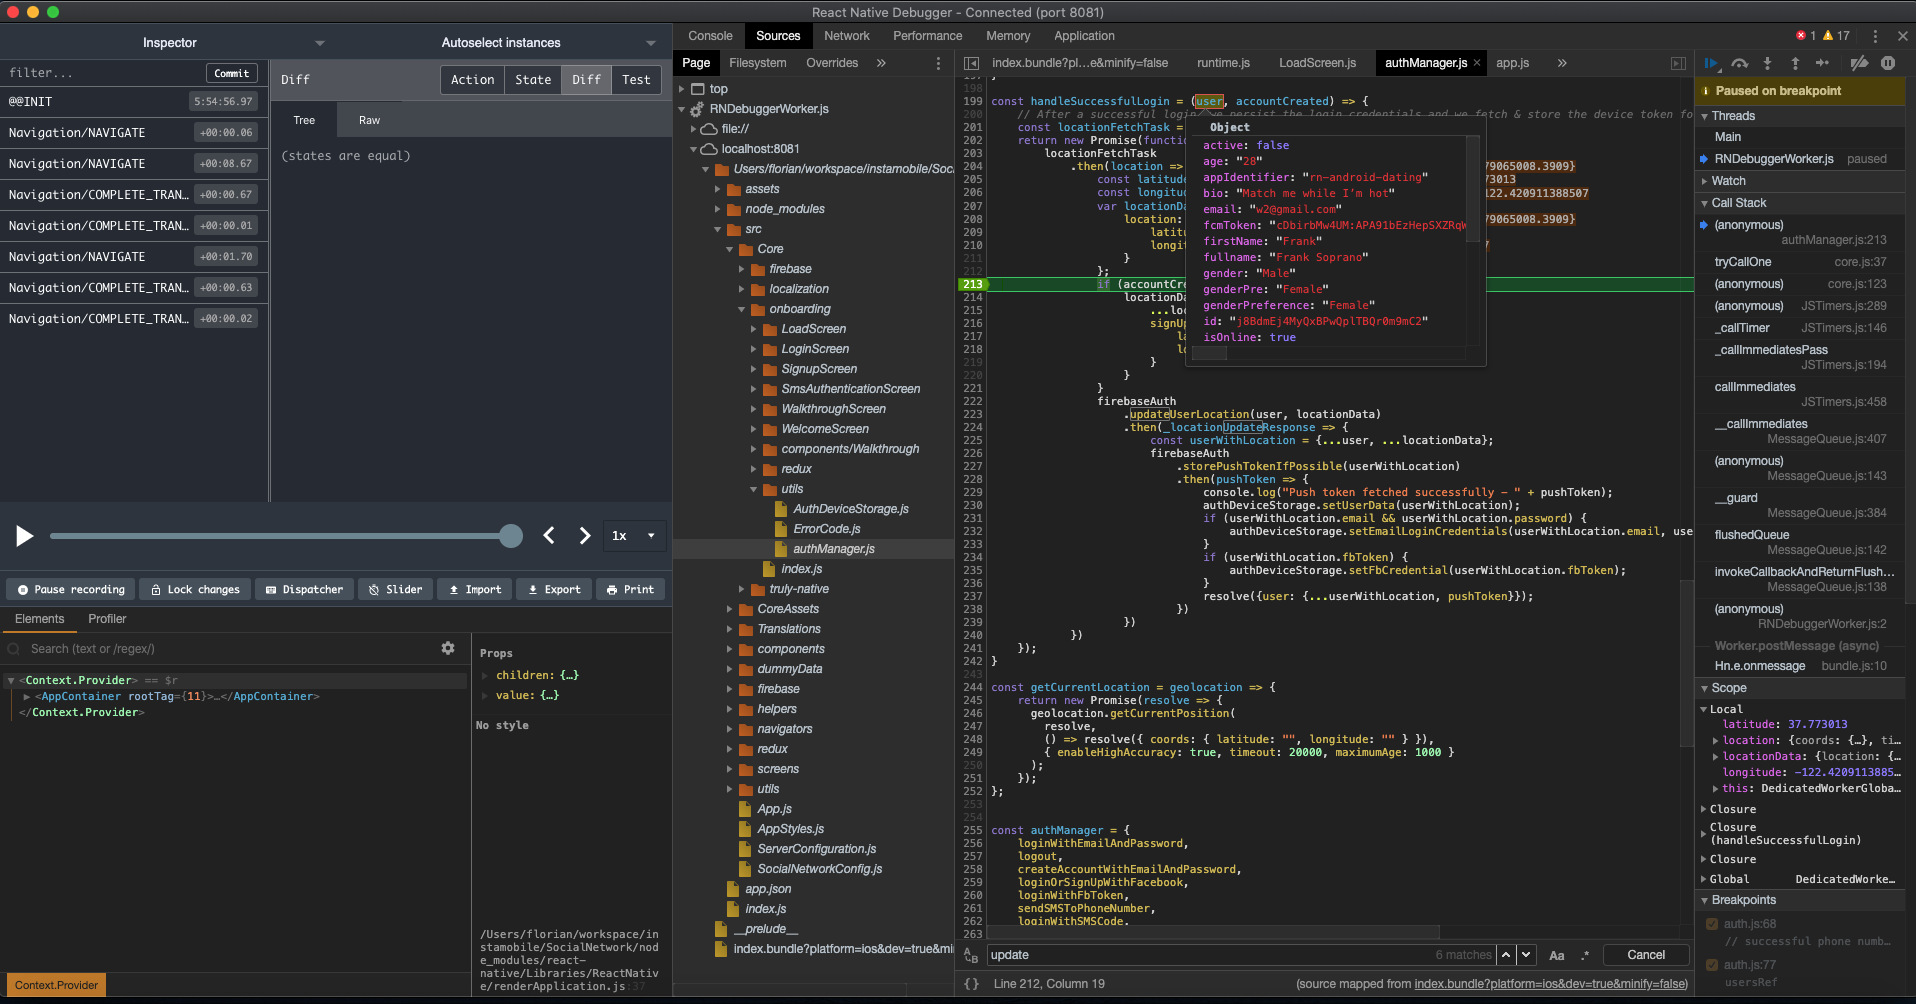
- In React Native Debugger, you can now Inspect all the variables from the current execution context, by simply hovering over them.
- You can also inspect other things, such as
- Console logs in the “Console” tab
- Network, Performance and Memory
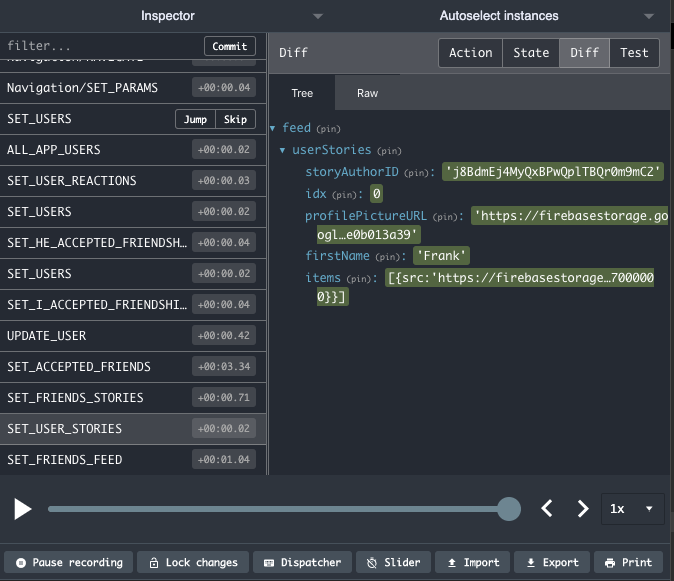
- The Navigation history and the timeline of the Redux changes (actions, states, diff), which is extremely helpful
-
In the right panel, you have access to a few more features and information, which comes in extremely handy for doing more insightful investigations, especially Threads and Call Stack.
- Threads – you can visualize all the active threads that were running right before the breakpoint was used
- Call Stack – you can see the call stack of the current thread where the breakpoint is being executed in. This is extremely useful for larger codebases, to get you familiar with complex execution stack (e.g. you can learn a codebase by adding random breakpoints and see when they hit and how the code got there and with what state).
There are also a lot more powerful tools in the React Native Debugger, besides breakpoints and the ones I enumerated here, but these are the most frequently used ones. You can play with the debugger yourself, set a few breakpoints and discover what’s available – don’t forget to take a look at the “Elements” tab as well as “Profiling”.
That’s it. You’ve learnt how to set up breakpoints in React Native code, by leveraging the powerful React Native Debugger application. With this, you get access to a ton of runtime information, such as the current variable context, view hierarchy (with all UI components, props & states), threading, call stack, redux history, etc.
Don’t forget that you don’t necessarily need React Native Debugger to add breakpoints to React Native applications. You can simply use Google Chrome directly, with its powerful developer tools. For web developers, this might be familiar already. Here’s how the Google Chrome debugger looks like:
Debugging your React Native code with breakpoints will save you a lot of time by cutting down the effort of finding issues, fixing bugs, building features or learning new codebases. The React Native Debugger is exponentially more critical as the codebase grows in the number of lines of code, files and UI hierarchy.
I hope you’ve found this article useful, and please don’t hesitate to reach out if you want me to dive deeper into any of the debugging areas I’ve mentioned here.
Next Steps
Now that you have learned about resources to learn React Native development, here are some other topics you can look into
-
Firebase — Push notifications | Firebase storage
-
How To in React Native — WebView | Gradient| Camera| Adding GIF| Google Maps | Redux | Debugging | Hooks| Dark mode | Deep-link | GraphQL | AsyncStorage | Offline |Chart | Walkthrough | Geolocation | Tinder swipe | App icon | REST API
-
Authentication — Google Login| Facebook login | Phone Auth |
-
Best Resource – App idea | Podcast | Newsletter| App template
If you need a base to start your next React Native app, you can make your next awesome app using manyReact Native template.